Sample Reports
Contractor WIP and 13-week cash forecast examples.
See how a work-in-progress (WIP) schedule and a rolling 13-week cash forecast help Washington contractor owners understand job margins, billing gaps and upcoming cash needs.
Example figures demonstrate how the reporting works. Your reports are tailored to your business, available records and agreed scope. See the service scope and fees →
WIP and job-margin example → 13-week cash forecast example →
Sample 1 · Work in Progress
Contractor WIP schedule: job progress and billing.
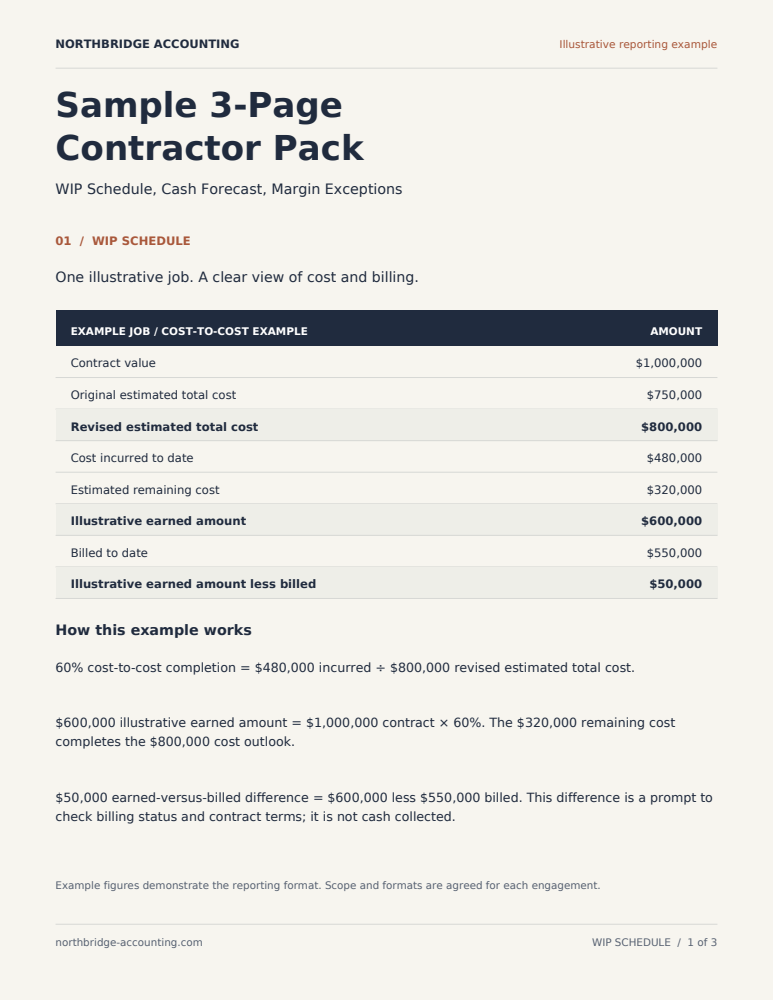
Job 14 — mechanical contract
| Contract value | $1,000,000 |
|---|---|
| Original estimated total cost | $750,000 |
| Revised estimated total cost | $800,000 |
| Cost incurred to date | $480,000 |
| Estimate to complete | $320,000 |
| Billed to date | $550,000 |
What this tells the owner
- A margin exception. The revised cost estimate moves expected gross profit from $250,000 (25%) to $200,000 (20%)—a five-point slip worth understanding before the next bid repeats it.
- Progress versus billing. The job has earned $600,000 against $550,000 billed, so $50,000 of completed work is not yet invoiced.
- The next questions. What changed in the remaining cost? What supports the billing gap, and when can it be invoiced?
A simplified illustration: completion here uses a cost-to-cost calculation for clarity, and the reporting basis in a real engagement depends on what is agreed. An underbilled amount is not cash in hand—collection follows the contract’s billing terms, and nothing here asserts collectibility or lender/surety acceptance.
Sample 2 · Rolling 13-Week Cash Forecast
13-week cash flow forecast: receipts, payments and balances.
13-week cash outlook
Projected week-end balances · Opening cash: $100,000
Lowest projected balance: $25,000 in week 3. Six consecutive weeks fall below the example’s $50,000 planning threshold.
Orange marks weeks 3–8, below the example’s planning threshold. Your threshold depends on your business and its commitments. Exact figures follow below.
| Week | Receipts | Payments | Ending balance |
|---|---|---|---|
| 1 | 80 | 95 | 85 |
| 2 | 90 | 100 | 75 |
| 3 | 60 | 110 | 25 |
| 4 | 110 | 90 | 45 |
| 5 | 80 | 85 | 40 |
| 6 | 100 | 95 | 45 |
| 7 | 95 | 100 | 40 |
| 8 | 90 | 85 | 45 |
| 9 | 105 | 90 | 60 |
| 10 | 115 | 110 | 65 |
| 11 | 80 | 95 | 50 |
| 12 | 120 | 105 | 65 |
| 13 | 110 | 100 | 75 |
What this tells the owner
- Cash timing. The lowest projected week-end balance arrives in week 3 ($25,000), driven by a light receipt week against steady payments—visible weeks ahead, while there is still time to act.
- A stretch to manage. The balance sits below the sample $50,000 threshold from week 3 through week 8, then rebuilds. The owner can weigh moving a payment, pulling an invoice forward or arranging other cover before committing cash.
- The next questions. Which receipts in weeks 2–3 are firm? Which payments have flexible timing?
A forecast organizes expected receipts and payments under stated assumptions. It is a planning tool that changes as real receipts, payments and operating plans change—it does not guarantee that cash will be sufficient.
Keep a copy of the reporting examples.
 Sample 3-Page Contractor Pack: WIP Schedule, Cash
Forecast, Margin Exceptions. Example figures demonstrate the reporting format. The PDF uses selectable text; this page is
the accessible web version of the same material.
Download the sample pack (PDF) →